News
KORE Mining Announces Positive Preliminary Economic Assessment for Imperial Oxide Gold Deposit
April 6, 2020
US$ 343 MILLION NPV5% WITH IRR OF 44% AT US$1,450 PER OUNCE GOLD
IMPERIAL PROJECT PEA HIGHLIGHTS:
- Robust economics: US$ 343 million NPV5% post-tax with 44% IRR at US$1,450 per ounce gold
- Low capital intensity project with only US$ 142 million pre-production capital cost
- 146,000 ounces gold per year over 8 years for 1.2 million ounces total production
- Technically simple project: shallow open pit, run-of-mine heap leach with existing infrastructure
- Significant leverage to gold price: US$ 464 million NPV5% at recent spot US$1,620 per ounce gold
- Value enhancement through Mesquite-Imperial-Picacho District exploration and resource expansion
Vancouver, BC April 6, 2020 - KORE Mining Ltd. (TSXV: KORE | OTCQB: KOREF) (“KORE” or the “Company”) is pleased to announce a positive Preliminary Economic Assessment (“PEA”) for the Company’s 100% owned Imperial Oxide Gold Deposit (“Imperial” or “Project”), located in California, USA. The PEA demonstrates Imperial’s potential to be a robust mid-tier gold mine with compelling project economics. In addition to the gold price, Imperial has upside potential from deposit extensions and exploration on the 100% owned Mesquite-Imperial-Picacho District which captures 28 kilometers of strike from the operating Mesquite mine (TSX:EQX) to the historic Picacho heap leach mine.
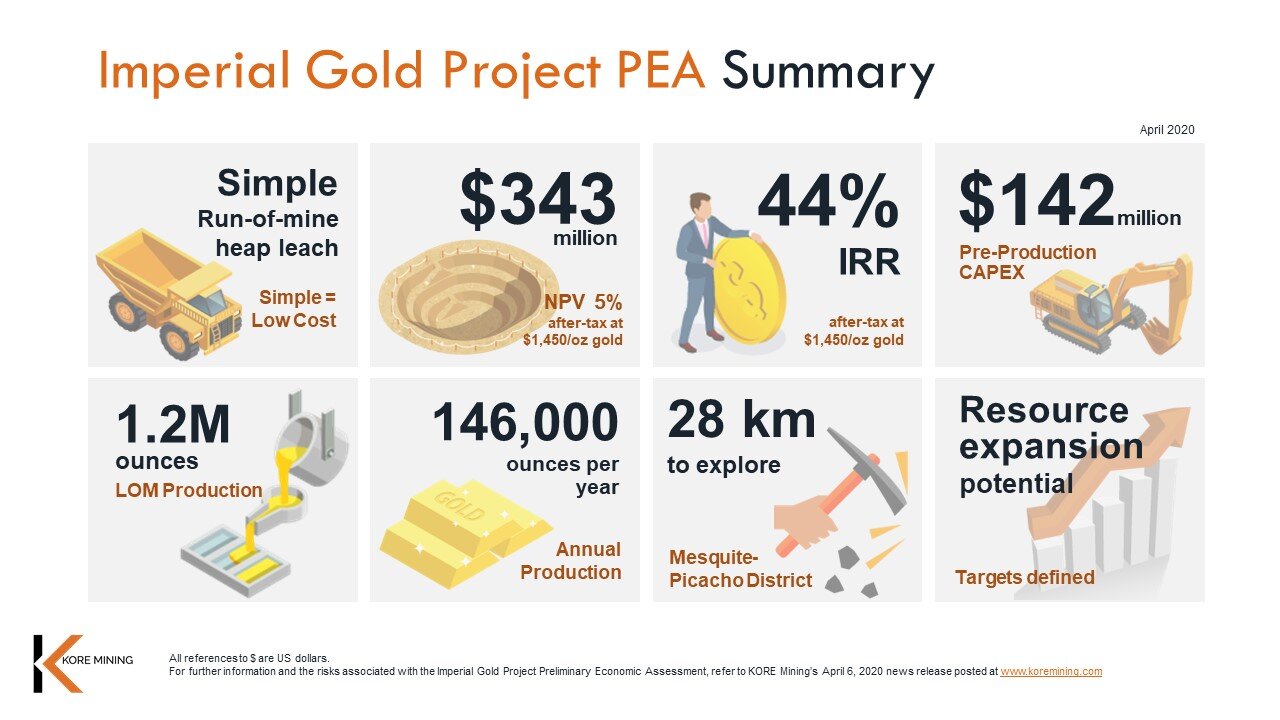
Watch a video (40 seconds) of Scott Trebilcock summarizing the highlights of the PEA – click here. Refer to the PEA Summary infographic in Figure 1.
The PEA is preliminary in nature, includes inferred mineral resources that are considered too speculative geologically to have the economic considerations applied to them that would enable them to be categorized as mineral reserves, and there is no certainty that the PEA will be realized. Mineral resources that are not mineral reserves do not have demonstrated economic viability.
KORE’s CEO Scott Trebilcock stated: “Imperial is a technically simple, high-return gold project in a safe, politically stable jurisdiction with a long tradition of gold mining. The PEA delivers robust project economics based on very reasonable capital expenditures. This low capital intensity derives from the simplicity of the project which will utilize conventional open pit mining techniques, proven processing and existing infrastructure.”
Mr. Trebilcock added: “We see the potential to increase value at Imperial through regional exploration and resource expansion drilling which are planned for later in 2020. The Imperial PEA generates strong returns at US$1,450 per ounce, but at near today’s spot price of US$1,600 per ounce, the project has potential to deliver exceptional returns with an NPV5% of US$ 450 million.”
Marc Leduc, KORE’s COO commented: “The mine plan at Imperial complies with California’s stringent reclamation and environmental laws while delivering skilled jobs and long-term regional economic development. We are excited to engage with local stakeholders and move the project into permitting later this year.”
Mr. Leduc added: “KORE considered several alternative options at this PEA stage, which have potential to deliver even higher NPVs by utilizing crushing and additional pre-stripping. A strategic decision was made to proceed with a lower pre-production capital plan while still delivering strong economic returns. As we advance Imperial, we will consider trade-offs and optimization opportunities to further maximize the project NPV.”
KORE will host a webcast on April 7, 2020 at 4PM ET / 1PM PT. See details below.
PEA SUMMARY
The PEA was prepared in accordance with National Instrument 43-101 (“NI 43-101”) by Global Resource Engineering (Denver) (“GRE”) - Terre Lane, RMSME MMSAQP, Todd Harvey, PhD, RMSME and supported by Geo-Logic Associates - Monte Christie, GE PE. The team was led by Marc Leduc, P.Eng. the COO of KORE Mining. The Company plans to file the PEA on SEDAR at www.sedar.com within 45 days in accordance with NI 43-101.
This news release contains information from a preliminary economic assessment, which is a conceptual study, and other forward-looking information about potential future results and events. Please refer to the cautionary statements in the footnotes below and the Cautionary Statements located at the end of this news release, which include associated assumptions, risks, uncertainties and other factors.
Unless otherwise stated, all dollar figures are in United States dollars (“$”) and masses are in short tons.
| PEA Economics (USD) | Pre-Tax | Post-Tax | |
|---|---|---|---|
| Net present value (NPV 5%) | $ millions | $437 | $343 |
| Internal rate of return (IRR) | % | 52% | 44% |
| Payback (undiscounted) | years | 2.3 | 2.7 |
| Average annual cash flow | $ millions | $104 | $90 |
| Cumulative cash flow (undiscounted) | $ millions | $694 | $577 |
| Gold price assumption | per ounce | $1,450 | |
| Mine life* | years | 8 | |
| Average annual mining rate | million stpa | 43.4 | |
| Average annual gold production | ounces/year | 145,600 | |
| Total LOM* recovered gold | ounces | 1,166,000 | |
| Initial capital costs | $ millions | $142 | |
*Life-of-mine (“LOM”) calculation and “Mine Life” is defined as the duration of mining operations, 8 years. There are additional years of site work for residual leaching, washing, back-filling and reclamation modelled.
GOLD PRICE SENSITIVITIES
The following table demonstrates the post-tax sensitivities of NPV and IRR to gold price per ounce. The base case, highlighted in the table below, assumes US$1,450 per ounce of gold:
| Economic Sensitivities to Gold Prices (post-tax) | ||
|---|---|---|
| Per ounce of gold | (NPV5%) millions | IRR% |
| US$1,300 | US$234 | 34% |
| US$1,450 | US$343 | 44% |
| US$1,600 | US$450 | 52% |
| US$1,800 | US$590 | 64% |
| US$2,000 | US$729 | 75% |
OPPORTUNITIES
The PEA outlined a number of initiatives that may enhance the Project including:
- Complete on-strike step-out drilling to potentially expand resources;
- Investigate targets along the Mesquite-Imperial-Picacho trend for new discoveries;
- Infill drill inferred areas with a goal of enhancing resource categorization;
- Consider moving directly to feasibility based on robust available data and simple trade-offs; a pre-feasibility not necessarily required;
- Examine potential for recoveries as high as 83% under crushing scenario; complete formal trade-off study;
- Complete additional run-of-mine ("ROM") metallurgical test work; and
- Perform additional aggregate tests and marketing studies on the clean alluvial sand and gravels.
NEXT STEPS
The engineering work completed for the PEA will also be used to complete an update to the Plan of Operations which is a key document to re-start the permitting process. KORE plans to submit an updated Plan of Operations to the Bureau of Land Management (“BLM”) in mid-2020 to re-start the permitting process for Imperial. The Company aims to be in a position to make a construction decision in three years from submission of the Plan of Operations.
In 2020 the Company will also press forward with enhancing the Project through exploration and further drilling. KORE will be applying for permits to drill high-priority Mesquite-Imperial-Picacho District exploration targets, resource expansion targets, and several infill holes to improve confidence in geo-tech, metallurgy and resource estimate data. The Company will also continue to explore the Mesquite-Picacho District claims to generate additional drill targets.
WEBCAST DETAILS
Management will host a webcast on April 7, 2020 at 4PM ET / 1PM PT to discuss the PEA. Register for the webcast here.
Please send your questions to management at moc.gninimerok@divad or at 833-237-2649. A replay of the webcast will be available with 24 hours on the Company’s website.
IMPERIAL PEA DETAILS
GRE notes that the Imperial Project has an abundant collection of data as a result of the exploration, engineering and environmental studies completed in the 1980s and 1990s. During that period, the Project had geotechnical drilling and modelling, heap leach designs, plant designs, surface water management designs, and hydrogeological modelling, to name just a few, that provided a credible data set to the project team. The Project also has metallurgical sampling and testing completed both by previous owners and an independent lab, reviewed by GRE, to support the initial engineering design. This data will act as an important background and aid in the design of future work on the project.
MINING & PROCESSING
The PEA presents an open-pit ROM heap leach scenario where oxide ore is stacked on the leach pads directly from the mine and is not crushed. In the design process, the engineering team also looked at several other scenarios:
- Higher NPV mine plan with earlier higher grades processed with additional pre-stripping;
- Contractor mining with lower pre-production capital and higher LOM operating costs; and
- Crushing higher grade ore from pit to increase recovery at expense of additional capital.
KORE management ultimately selected the scenario with the lowest pre-production capital. A more capital-intensive approach could yield a mine and processing plan with higher project NPV and gold production.
| Mining Plan and Processing Summary | ||
|---|---|---|
| Mine life | years | 8 |
| Mining rate | average tons per day | 124,000 |
| Strip ratio | waste: mineralization | 2.8 |
| Total tonnage mined | million tons | 347.4 |
| Total mineralized material mined | million tons | 91.5 |
| Heap leach stacking rate | average tons per day | 33,000 |
| Average LOM grade | gram per metric tonne | 0.60 |
| Average LOM recovery | % | 73% |
A detailed mine plan by year is included in Table 1 at the end of this news release.
OPERATING COSTS
Mining costs for owner operated mining, processing and other costs were developed from a mix of first-principle engineering and benchmarked to the many ROM heap leach operations in California and nearby Nevada. The Imperial Project is located near a large skilled labour pool and on the same road and power infrastructure as the operating Mesquite mine, located nine miles away providing further confidence in the cost estimates.
| Operating Costs (LOM average) (1) | ||
|---|---|---|
| Mining costs (per ton mined) | US$/st mined | $1.47 |
| Mining costs | US$/st processed | $5.57 |
| Processing costs | US$/st processed | $1.85 |
| G&A costs | US$/st processed | $0.74 |
| Total site operating costs | US$/st processed | $8.16 |
| Cash Costs* | ||
| Cash costs (LOM)* | US$/oz | $676 |
- Not including post-production reclamation and backfilling. See LOM description above.
The assumed truck diesel fuel price in the PEA is $2.38 per US gallon. About 19% of the mining cost is fuel so lower fuel prices would decrease mining costs moderately.
INITIAL PRE-PRODUCTION AND SUSTAINING CAPITAL COSTS
Initial capital costs in the PEA are US$142 million including a 25% contingency of US$23.6 million. The initial mine fleet will be expanded in Year 1 of operations. Infrastructure costs are low due to the proximity of road, water and power infrastructure. Initial capital also assumes KORE is the owner-operator of all equipment. Further enhancements may be possible with contract mining or processing of the gold from the carbon columns at an off-site treatment plant. Sustaining capital is mainly for heap leach pad expansion and additional mining equipment.
| Pre-Production and Sustaining Capital Costs (US$ millions) | |
|---|---|
| Mining and mine infrastructure | $35.3 |
| Heap leach pads and plant | $47.0 |
| Infrastructure and G&A | $15.7 |
| Working capital | $7.6 |
| Contingency (25%) | $23.6 |
| Pre-production mining | $12.6 |
| Total Pre-Production Cost | $141.8 |
| LOM sustaining capital | $60.2 |
| Closure incl. backfill (1) | $144.6 |
- Closure cost includes final backfilling of the open pit and site reclamation to California’s regulated standards. The cost includes US$107 million in mining cost, US$12 million in site operating G&A during back-filling of the final pit, in addition to US$25 million in other site closure costs. Backfill will return the site to plus 25 feet of original topography while re-establishing natural desert washes (drainages). A 95-million-ton clean alluvial sand and gravel stockpile remain and serve as an aggregate source for local and regional infrastructure. The balance of the closure cost is for normal non-backfill site closure costs to remediate disturbances, remove structures, etc.
ALL-IN-SUSTAINING-COST*
All-in-sustaining costs (“AISC”)* are competitive with peer projects and in the second quartile when compared to the World Gold Council AISC cost metric. Imperial’s AISC* is built up as follows:
| AISC* per ounce | |
|---|---|
| Operating cost (1) | US$647 |
| Royalties (2) | US$29 |
| Sustaining capital | US$52 |
| Closure | US$124 |
| Total AISC* | US$852 |
- Operating costs includes US$5 per ounce offsite refining.
- Royalties consist of: (a) 1% NSR royalty to Newmont-Goldcorp; and (b) 1% NSR royalty to Macquarie Bank that has a C$6.75 million buyout before May 6, 2020.
MINERAL RESOURCE ESTIMATE
Imperial is well drilled with 349 boreholes drilled by various operators during the period of 1987-1996.
The mineral resource estimate remains unchanged from December 30, 2019 and was prepared by SRK Consulting (Canada) Inc. - Glen Cole, PGeo., Anoush Ebrahimi, PEng., and Mark Willow, PEng. The resource block model derived by SRK was used in the development of this PEA.
The following table shows the Imperial Project mineral resource estimate as of December 30, 2019:
| Classification | Quantity (‘000 tons) |
Grade Gold (oz/t) |
Contained Gold (‘000 oz) |
|---|---|---|---|
| Indicated | |||
| Grade Zone (Domains 100, 120) | 50,379 | 0.0174 | 877 |
| Total Indicated | 50,379 | 0.0174 | 877 |
| Inferred | |||
| Grade Zone (Domains 100, 110, 120) | 79,869 | 0.0156 | 1,245 |
| Gravel with grade (Domain 200) | 10,557 | 0.0041 | 43 |
| Bedrock with grade (Domain 300) | 9,748 | 0.005 | 48 |
| Total Inferred | 100,174 | 0.0133 | 1,336 |
Reported at a cut-off grade of 0.003 oz/ton Au using a price of US$1,500 /oz Au inside a conceptual pit shell optimized using mining operating costs of US$1.40 per ton, metallurgical and process recovery of 80%, combined processing and G&A costs of US$2.30 per ton, US$0.50 per ton of sustaining capital and overall pit slope of 45 degrees. All figures rounded to reflect the relative accuracy of the estimates.
Further details on the mineral resource estimate are available in the technical report dated December 30, 2019 entitled “Amended Technical Report for the Imperial Gold Project, California, USA” available at www.koremining.com and filed on January 20, 2020 at www.sedar.com.
QUALIFIED PERSONS/QUALITY ASSURANCE
The Preliminary Economic Assessment was prepared by GRE with Terre Lane, PE being the Qualified Person in charge of its preparation. The resource portion of the PEA is the same as the previous technical report dated December 30, 2019 and was prepared by SRK Consulting (Canada) Inc. - Glen Cole, PGeo., Anoush Ebrahimi, PEng., and Mark Willow, PEng. With regards to technical matters in this press release Marc Leduc, P.Eng. is the Qualified Person within the meaning of NI 43-101 and has reviewed and validated that the information in this press release is consistent with that provided by the Qualified Persons responsible for the PEA.
Further information about the PEA referenced in this news release, including information in respect of data verification, key assumptions, parameters, risks and other factors, can be found in the NI 43-101 technical report for the Imperial Oxide Gold Deposit that the Company intends to file on SEDAR (www.sedar.com) under KORE’s profile and on the Company’s website (www.koremining.com) within the next 45 days from the date of this news release.
ALTERNATIVE PERFORMANCE MEASURES (NON-IFRS MEASURES)
Items marked with a * in this news release are alternative performance measures. Alternative performance measures are furnished to provide additional information. These non-IFRS performance measures are included in this news release because the Company believes these statistics are key performance measures that provide investors, analysts and other stakeholders with additional information to understand the costs associated with the Project. These performance measures do not have a standard meaning within IFRS and, therefore, amounts presented may not be comparable to similar data presented by other mining companies. These performance measures should not be considered in isolation as a substitute for measures of performance in accordance with IFRS.
“Cash Costs ” and “Cash Costs (LOM)” are a non-IFRS measure reported by KORE on an ounces of gold sold basis. Cash costs include mining, processing, refining, general and administration costs and royalties but excludes depreciation, reclamation, income taxes, capital and exploration costs for the life of the mine, defined above as 8 years.
“All-In-Sustaining-Costs” (“ASIC”) is a non-IFRS measure reported by KORE on a per ounce of gold sold basis that includes all cash costs noted above (mining, processing refining, general and administration and royalties), as well as sustaining capital and closure costs, but excludes depreciation, capital costs and income taxes.
ABOUT IMPERIAL OXIDE GOLD DEPOSIT
Imperial is a structurally controlled intermediate epithermal gold deposit. The oxide gold deposit is currently 2.44 kilometers long, up to 0.75 kilometers wide and is open both along strike and downdip. KORE controls the 28 km long Mesquite-Imperial-Picacho exploration district, including 1,005 claims staked in September 2019, between Mesquite and Picacho that runs through Imperial. This trend remains underexplored and open to new oxide discoveries. More details on the deposit geology and exploration potential can be found in KORE’s January 7, 2020 and September 12, 2019 news releases.
ABOUT KORE
KORE is 100% owner of a portfolio of advanced gold exploration and development assets in California and British Columbia. KORE is supported by strategic investors Eric Sprott and Macquarie Bank who, together with the management and Board own 66% of the basic shares outstanding.
Further information on Imperial and KORE can be found on the Company’s website at www.koremining.com or by contacting us as moc.gninimerok@ofni or by telephone at (888) 407-5450.
On behalf of KORE Mining Ltd
”Scott Trebilcock”
Chief Executive Officer
(888) 407-5450
This news release does not constitute an offer to sell or a solicitation of an offer to sell any KORE common shares in the United States.
Neither the TSX Venture Exchange nor its Regulation Services Provider (as that term is defined in the policies of the TSX Venture Exchange) accepts responsibility for the adequacy or accuracy of this release.
Cautionary Statement Regarding Forward-Looking Information
This news release contains forward-looking statements relating to the future operations of the Company and other statements that are not historical facts. Forward-looking statements are often identified by terms such as "will", "may", "should", "anticipate", "expects", “intends”, “indicates” and similar expressions. All statements other than statements of historical fact, included in this release, including, without limitation, statements regarding the future plans and objectives of the Company are forward-looking statements. Forward-looking statements in this news release include, but are not limited to, statements with respect to: the results of the PEA, including future Project opportunities, future operating and capital costs, closure costs, AISC, the projected NPV, IRR, timelines, permit timelines, and the ability to obtain the requisite permits, economics and associated returns of the Imperial Project, the technical viability of the Imperial Project, the market and future price of and demand for gold, the environmental impact of the Imperial Project, and the ongoing ability to work cooperatively with stakeholders, including the local levels of government. Such forward-looking statements, and any assumptions upon which they are based, are made in good faith and reflect our current judgment regarding the direction of our business. Management believes that these assumptions are reasonable. Forward looking information involves known and unknown risks, uncertainties and other factors which may cause the actual results, performance or achievements of the Company to be materially different from any future results, performance or achievements expressed or implied by the forward-looking information.
Such factors include, among others: risks related to exploration and development activities at the Company’s projects, and factors relating to whether or not mineralization extraction will be commercially viable; risks related to mining operations and the hazards and risks normally encountered in the exploration, development and production of minerals, such as unusual and unexpected geological formations, rock falls, seismic activity, flooding and other conditions involved in the extraction and removal of materials; uncertainties regarding regulatory matters, including obtaining permits and complying with laws and regulations governing exploration, development, production, taxes, labour standards, occupational health, waste disposal, toxic substances, land use, environmental protection, site safety and other matters, and the potential for existing laws and regulations to be amended or more stringently implemented by the relevant authorities; uncertainties regarding estimating mineral resources, which estimates may require revision (either up or down) based on actual production experience; risks relating to fluctuating metals prices and the ability to operate the Company’s projects at a profit in the event of declining metals prices and the need to reassess feasibility of a particular project that estimated resources will be recovered or that they will be recovered at the rates estimated; risks related to title to the Company’s properties, including the risk that the Company’s title may be challenged or impugned by third parties; the ability of the Company to access necessary resources, including mining equipment and crews, on a timely basis and at reasonable cost; competition within the mining industry for the discovery and acquisition of properties from other mining companies, many of which have greater financial, technical and other resources than the Company, for, among other things, the acquisition of mineral claims, leases and other mineral interests as well as for the recruitment and retention of qualified employees and other personnel; access to suitable infrastructure, such as roads, energy and water supplies in the vicinity of the Company’s properties; and risks related to the stage of the Company’s development, including risks relating to limited financial resources, limited availability of additional financing and potential dilution to existing shareholders; reliance on its management and key personnel; inability to obtain adequate or any insurance; exposure to litigation or similar claims; currently unprofitable operations; risks regarding the ability of the Company and its management to manage growth; and potential conflicts of interest.
In addition to the above summary, additional risks and uncertainties are described in the “Risks” section of the Company’s management discussion and analysis for the interim period ended September 30, 2019 prepared as of November 28, 2019 available under the Company’s issuer profile on www.sedar.com.
Forward-looking statements contained herein are made as of the date of this news release and the Company disclaims any obligation to update any forward-looking statements, whether as a result of new information, future events or results, except as may be required by applicable securities laws. There can be no assurance that forward-looking information will prove to be accurate, as actual results and future events could differ materially from those anticipated in such statements. Accordingly, readers should not place undue reliance on forward-looking information.
There is no certainty that all or any part of the mineral resource will be converted into mineral reserve. It is uncertain if further exploration will allow improving the classification of the Indicated or Inferred mineral resource. Mineral resources are not mineral reserves and do not have demonstrated economic viability.
Cautionary Note Regarding Mineral Resource Estimates: Information regarding mineral resource estimates has been prepared in accordance with the requirements of Canadian securities laws, which differ from the requirements of United States Securities and Exchange Commission (“SEC”) Industry Guide 7. In October 2018, the SEC approved final rules requiring comprehensive and detailed disclosure requirements for issuers with material mining operations. The provisions in Industry Guide 7 and Item 102 of Regulation S-K, have been replaced with a new subpart 1300 of Regulation S-K under the United States Securities Act and will become mandatory for SEC registrants after January 1, 2021. The changes adopted are intended to align the SEC’s disclosure requirements more closely with global standards as embodied by the Committee for Mineral Reserves International Reporting Standards (CRIRSCO), including Canada’s NI 43-101 and CIM Definition Standards. Under the new SEC rules, SEC registrants will be permitted to disclose “mineral resources” even though they reflect a lower level of certainty than mineral reserves. Additionally, under the New Rules, mineral resources must be classified as “measured”, “indicated”, or “inferred”, terms which are defined in and required to be disclosed by NI 43-101 for Canadian issuers and are not recognized under SEC Industry Guide 7. An “Inferred Mineral Resource” has a lower level of confidence than that applying to an “Indicated Mineral Resource” and must not be converted to a Mineral Reserve. It is reasonably expected that the majority of “Inferred Mineral Resources” could be upgraded to “Indicated Mineral Resources” with continued exploration. Accordingly, the mineral resource estimates and related information may not be comparable to similar information made public by United States companies subject to the reporting and disclosure requirements under the United States federal laws and the rules and regulations thereunder, including SEC Industry Guide 7.
TABLE 1 – DETAILED MINE PLAN
| Years | ||||||||||
|---|---|---|---|---|---|---|---|---|---|---|
| LOM Total | -1 | 1 | 2 | 3 | 4 | 5 | 6 | 7 | 8 | |
| Ore (ton) | 91,486,702 | - | 12,013,714 | 12,242,104 | 11,925,634 | 12,085,395 | 12,800,760 | 11,276,396 | 12,572,820 | 6,569,878 |
| Alluvium Waste (ton) | 208,451,176 | 297,484 | 23,308,335 | 34,289,831 | 32,037,306 | 25,436,635 | 34,779,864 | 33,323,544 | 24,978,176 | - |
| Hard Rock Waste (ton) | 47,490,579 | - | 10,462,323 | 2,061,740 | 3,794,258 | 6,121,084 | 4,223,584 | 4,106,393 | 15,563,063 | 1,158,135 |
| Total Waste Tons (ton) | 255,941,755 | 297,484 | 33,770,657 | 36,351,570 | 35,831,564 | 31,557,720 | 39,003,447 | 37,429,937 | 40,541,239 | 1,158,135 |
| Stripping Ratio | 2.8 | - | 2.8 | 3.0 | 3.0 | 2.6 | 3.0 | 3.3 | 3.2 | 0.2 |
| Mined Ore Grade (g/t) | 0.60 | - | 0.49 | 0.51 | 0.52 | 0.54 | 0.71 | 0.64 | 0.73 | 0.68 |
| Contained Gold (troy oz) | 1,595,368 | - | 173,140 | 181,781 | 179,011 | 188,860 | 265,995 | 210,688 | 266,319 | 129,574 |
FIGURE 1: PEA SUMMARY